
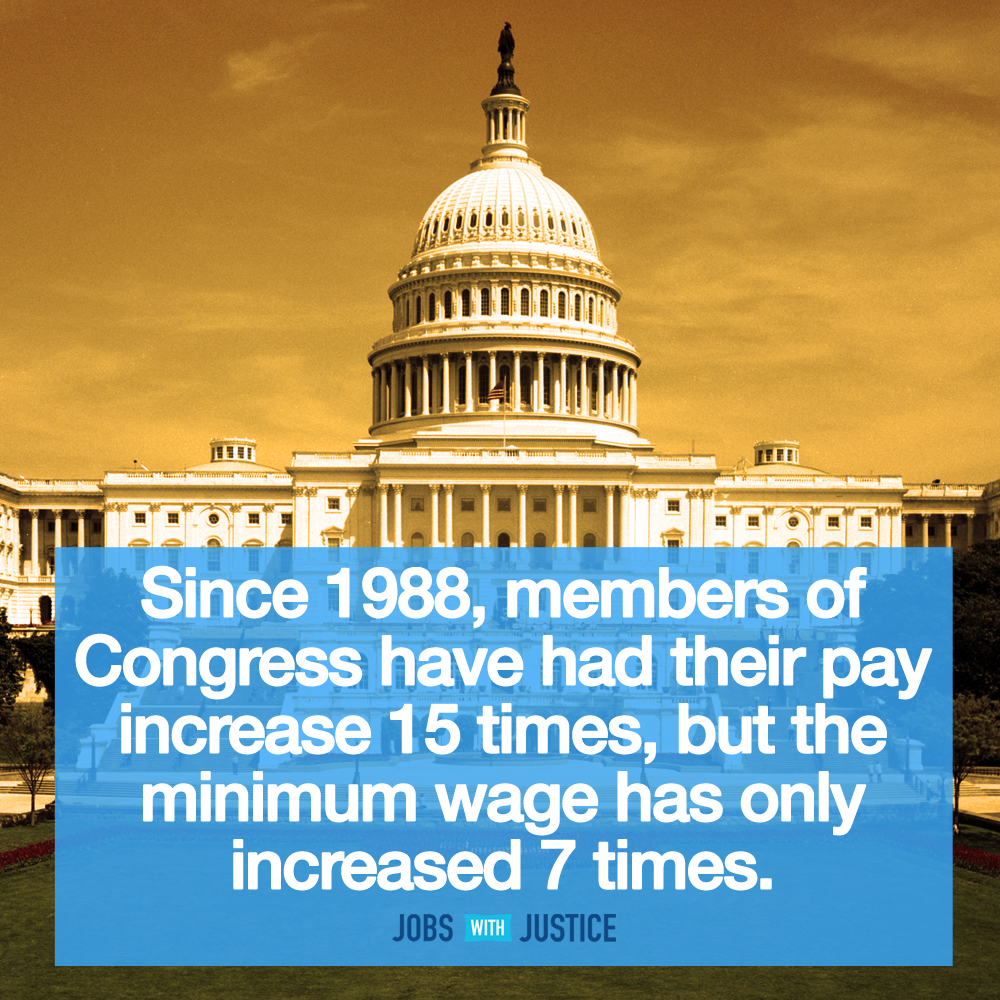

See for yourself:
| Year | Minimum wage | Representative Salary | Senator Salary |
| 1988 | $3.35 | $89,500 | $89,500 |
| 1989 | $3.35 | $89,500 | $89,500 |
| 1990 | $3.80 | $96,600 | $98,400 |
| 1991 | $4.25 | $125,100 | $125,100 |
| 1992 | $4.25 | $129,500 | $129,500 |
| 1993 | $4.25 | $133,600 | $133,600 |
| 1994 | $4.25 | $133,600 | $133,600 |
| 1995 | $4.25 | $133,600 | $133,600 |
| 1996 | $4.75 | $133,600 | $133,600 |
| 1997 | $5.15 | $133,600 | $133,600 |
| 1998 | $5.15 | $136,700 | $136,700 |
| 1999 | $5.15 | $136,700 | $136,700 |
| 2000 | $5.15 | $141,300 | $141,300 |
| 2001 | $5.15 | $145,100 | $145,100 |
| 2002 | $5.15 | $150,000 | $150,000 |
| 2003 | $5.15 | $154,700 | $154,700 |
| 2004 | $5.15 | $158,100 | $158,100 |
| 2005 | $5.15 | $162,100 | $162,100 |
| 2006 | $5.15 | $165,200 | $165,200 |
| 2007 | $5.85 | $169,300 | $169,300 |
| 2008 | $6.55 | $174,000 | $174,000 |
| 2009 | $7.25 | $174,000 | $174,000 |
| 2010 | $7.25 | $174,000 | $174,000 |
| 2011 | $7.25 | $174,000 | $174,000 |
| 2012 | $7.25 | $174,000 | $174,000 |
| 2013 | $7.25 | $174,000 | $174,000 |
| 2014 | $7.25 | $174,000 | $174,000 |
Source: U.S. Department of Labor Wage and Hour Division & Congressional Research Service.